
HOW-TO: Create the Projected Financial Impact of Lameness Report in Hoof Supervisor

The Projected Financial Impact of Lameness Report is a management tool pointing out the additional costs and losses due to the lesions affecting individual dairies today or any time period included in the report. The more time or cows that are included for each herd, the better the picture that the report provides of the impacts of lameness affecting each dairy’s bottom line.
Use this report to better define and understand where your biggest lameness issues are coming from. Higher infectious lesion levels point to reviewing footbath protocols, frequency of its use, size, and which animals have access to it. High non-infectious levels point to cow comfort, traffic areas, stall areas, standing time, etc.
Use this report with herd managers and owners to justify the cost(s) of making improvements whether it be in protocol changes or facility upgrades that help reduce and eliminate the lesion(s) affecting their herd. Reduce lameness issues by fixing or changing what is causing it in the first place. Don’t accept lameness as a ‘normal, expected’ outcome on your dairy!
There are two ways to generate this report:
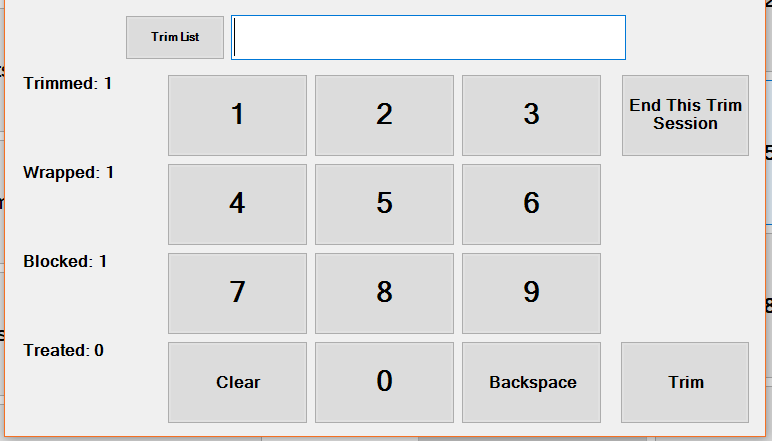
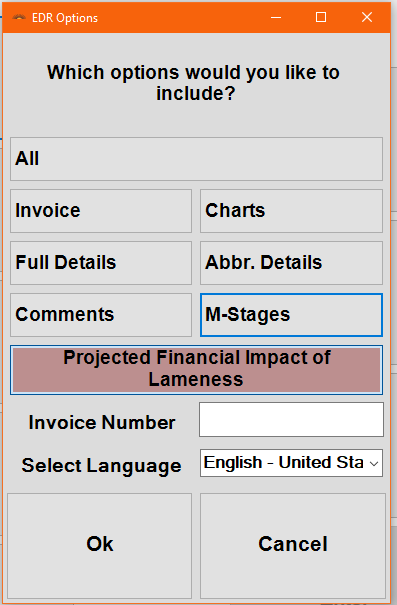
- When finished trimming for the day, from the Enter Cow ID screen > End This Trim Session. On the End of Day Options (EDR) Screen, make sure the “Projected Financial Impact of Lameness” option is highlighted or shaded in red. This option includes the cows trimmed during the current trim session on the report.
- View Reports tab > Select the Time period you want included in the report. Make sure the “Projected Financial Impact of Lameness report” option is highlighted/shaded in red. This option includes all the cows trimmed during the specified dates included on the report. Run for a day, a month or a year or any specific range of time.
Enter Cow ID screen
End of Day Report (EDR) Options screen
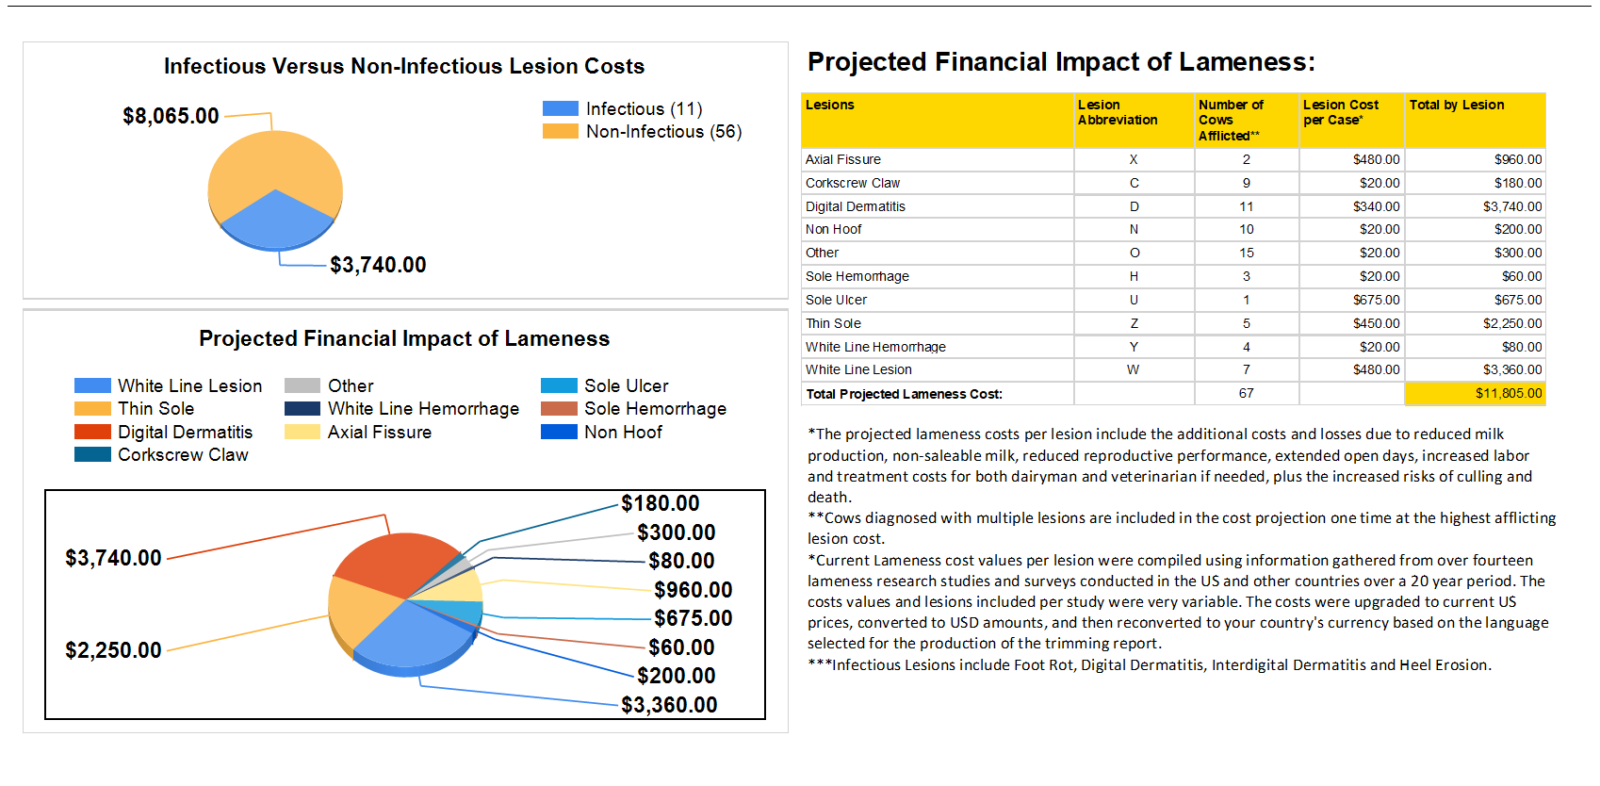
The Projected Financial Impact of Lameness report includes 4 parts:
- Infectious Versus Non-Infectious Lesion Costs. Shows the cost and number of cows for each type.
- Pie Chart showing all lesions identified and their respective cost per lesion times the number of affected cows.
- Each lesion with the corresponding or associated cost per lesion, number of affected cows, and total projected economic loss per each lesion with a total projected cost per herd.
- Explanation of the projected lameness costs or losses per lesion, what cost factors are included in the calculations for each lesion loss, and how and where these lesion costs were derived from.
Below is an example of the Projected Financial Impact of Lameness report:
We built this report to bring you value and to help you make confident, educated decisions. Need further help? Call our office at 715-755-3575.